Your BI dashboards are invisible to AI
· 8 min read TL;DR
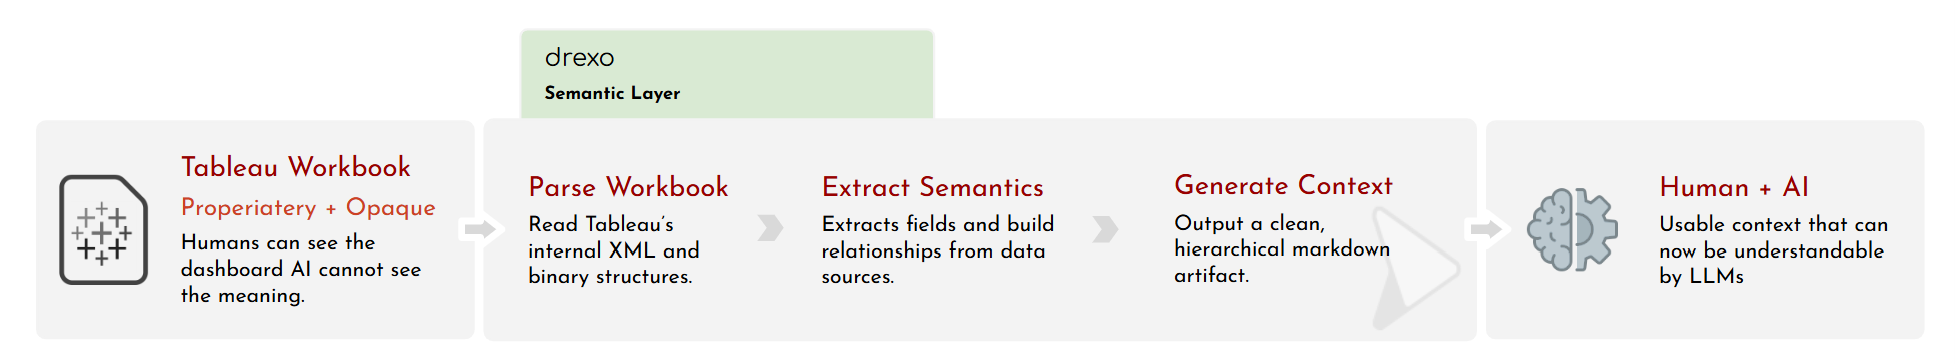
Most BI dashboards were built for humans to look at, not for AI systems to understand. The business logic inside Tableau workbooks — metrics, calculations, filters, relationships, and KPI definitions — is trapped inside proprietary formats that are effectively opaque to LLMs.
drexo converts Tableau workbooks into structured, AI-readable semantic representations.
- Extracts datasources, fields, calculations, filters, parameters, and dashboard layouts
- Converts proprietary workbook internals into structured markdown + YAML
- Makes dashboard logic readable by both humans and LLMs
- Enables semantic search, lineage analysis, and migration validation
- Allows AI systems to reason about metrics, relationships, and KPI definitions
- Creates a machine-readable representation layer for BI systems
- Turns dashboards from opaque rendering artifacts into queryable infrastructure
The core idea is simple:
AI cannot reliably operate on systems it cannot semantically represent.
Code: github.com/raguvindtharanitharan/drexo.
The problem is not rendering dashboards
Most companies already have years of business logic trapped inside dashboards.
Not in source control. Not in semantic layers. Inside Tableau workbooks.
Your company probably has 40 Tableau dashboards. Maybe 200. Most of them were built by someone who left two years ago. The business logic is buried in calculated fields named Calculation_1107604067. The datasource points to schemas nobody has fully documented. And every month, you pay Salesforce thousands of dollars so people can look at charts they don’t fully trust.
The problem is not that these dashboards exist.
The problem is that nobody — including AI systems — can actually understand them.
Modern BI tools were designed to render charts for humans. But AI systems need something fundamentally different: a semantic representation of the report itself. Metrics. Calculations. Field relationships. Visual encodings. Interaction logic. The meaning underneath the dashboard.
Most of that context is still trapped inside proprietary workbook formats.
I built drexo because I was tired of that situation. But the first thing I shipped wasn’t a migration engine. It was a semantic representation layer for Tableau workbooks.
That probably sounds underwhelming.
It isn’t.
The problem with migration tools
Most Tableau migration tools make the same assumption:
Tableau workbook → generated applicationPoint the tool at a workbook and out comes React code. The implicit promise is straightforward:
you’ll never have to open Tableau again.
But in practice, most generated output has the same problem. It reproduces the visuals without reconstructing the meaning underneath them.
Calculated fields become opaque helper functions. Datasource assumptions disappear into generated code. KPI logic gets flattened into components nobody wants to maintain. Teams still end up manually validating metrics dashboard by dashboard because nobody fully trusts the migration.
The migration technically succeeds. Operationally, nothing became easier to understand. That’s because the missing piece isn’t better code generation. It’s semantic representation.
Most migration tooling treats Tableau as a rendering problem. But Tableau workbooks are really compressed semantic systems containing years of accumulated operational context: KPI definitions, revenue logic, segmentation rules, visual interpretation layers, filters, business assumptions, and interaction behavior.
Until that context is extracted into a structured representation, every migration engine is effectively guessing. That realization completely changed how I approached drexo.
Dashboards are semantic systems
The deeper realization for me was that Tableau workbooks are not really dashboard files anymore. In most companies, they are undocumented operational systems.
A typical workbook contains business definitions that may not exist anywhere else in the organization. Revenue calculations. Retention formulas. Attribution logic. Executive reporting assumptions. Operational metrics that entire teams make decisions from daily.
Humans can usually navigate this mess through familiarity and tribal knowledge. AI systems cannot.
This becomes obvious the moment you try using LLMs operationally against BI systems. You can upload dashboard screenshots into ChatGPT and ask it to explain the report. Sometimes the answer even sounds convincing. But the model is mostly inferring from visuals. It cannot actually inspect formulas, datasource relationships, aggregation behavior, filters, dependencies, or the semantic assumptions underneath the charts.
The dashboard is visible. The logic is not.
That distinction matters much more than most people realize. AI systems fundamentally operate on context. The quality of reasoning depends heavily on the quality of context exposed to the model. Right now, most BI systems expose very poor context to AI.
How drexo Converts Tableau into AI-Readable Context
When you run:
npx drexo@latest analyze ./workbook.twbxdrexo does not generate a React application. It generates a structured markdown artifact describing the workbook itself.
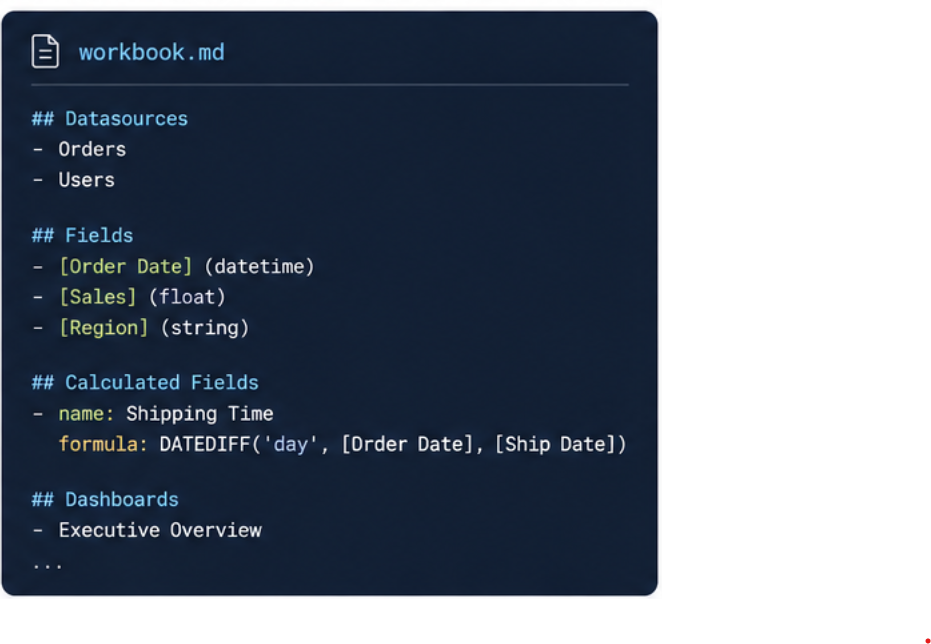
Every datasource. Every field. Every calculated formula. Every worksheet. Every dashboard zone. Every parameter and filter. Every visual encoding. A calculated field buried deep inside workbook XML:
fields:
  - name: "[Calculation_1107604067]"
    caption: "Shipping Time"
    role: measure
    data_type: integer
    is_calculated: true
    formula: "DATEDIFF('day', [Order Date], [Ship Date])"
    default_aggregation: AVG
suddenly becomes understandable in plain text.
That changes the interaction model completely. The workbook becomes readable, inspectable, and queryable in a way it never was inside Tableau itself. Humans can finally inspect years of accumulated reporting logic without opening Tableau. More importantly, AI systems can now reason about the workbook semantically instead of trying to infer meaning from rendered charts.
Once the workbook exists as structured text, entirely new workflows become possible:
- Which dashboards define churn differently?
- Which calculated fields depend on Order Date?
- Which reports likely contain duplicated business logic?
- Which KPIs are executive-facing?
- Which dashboards would be difficult to migrate?
The workbook stops being just a rendering artifact. It becomes queryable infrastructure.
The metadata layer becomes the platform
While building this, I kept thinking about dbt’s manifest.json. One of the most important things dbt introduced into the modern data stack was not actually SQL transformation. It was representation: a structured artifact describing the project itself.
That artifact became the foundation for observability tooling, lineage systems, governance platforms, CI workflows, semantic catalogs, and documentation systems. Entire categories of tooling emerged because dbt exposed a machine-readable representation of the project.
I think BI systems are heading toward the same transition.
The semantic representation layer eventually becomes more important than the migration itself. The React generator is just one downstream consumer of the metadata. The same artifact could eventually power AI investigation agents, dashboard lineage systems, semantic search, governance tooling, migration validation, KPI drift detection, and operational copilots.
That’s the architectural shift I think is happening underneath a lot of current AI tooling.
The systems that work best with AI will not just expose interfaces. They will expose semantic representations of themselves — representations humans can inspect, agents can reason about, and downstream systems can build upon.
We already see this pattern emerging everywhere: dbt manifests, OpenAPI specs, Terraform plans, MCP tool schemas, lineage graphs, semantic catalogs.
AI systems do not operate effectively against opaque infrastructure. They require representations.
For BI systems, that starts with metadata.
Most dashboards are invisible operational systems
We tested drexo against 65 real Tableau workbooks ranging from small public samples to production level workbooks that were over 1 GB in size. Sixty-four parsed successfully. The single failure was not actually a parser issue — it was a raw .twb file incorrectly renamed as .twbx.
But the interesting part was not the parse rate.
It was watching old dashboards suddenly become understandable once converted into structured text.
People could finally inspect years of accumulated business logic without opening Tableau at all. More interestingly, once we fed the generated markdown into LLMs, the models were able to explain what the dashboards measured, identify key metrics and calculations, and describe how the reports were constructed.
Not from screenshots.
From semantic representation.
That turned out to be much more useful than I originally expected. Because most enterprise dashboards are not really reports anymore.
They are invisible operational systems.
And right now, most AI systems are effectively blind to them.
Try it
npx drexo@latest analyze ./your-workbook.twbxRight now I care about one thing only:
Does the semantic representation accurately describe the workbook?
Because if the representation is wrong, every downstream migration, investigation, audit, or AI workflow built on top of it will also be wrong.
That layer has to become trustworthy first.
Everything else comes after that.